
-

AIX Exchange携手币安生态矩阵,揭幕“Web3版纳斯达克”
发布时间:2025/10/23
10月24日20:00,全球知名区块链媒体非小号(Feixiaohao.ai)、TalkingWeb3将携手AIXExchange和全球百大KOL举办华语区线上首秀特别直播,正式揭开“Web3版纳斯达克”的序幕。本次活动将在X、币安广场、币安Live、火...
-

撒钱十个亿,只做真公益!振东制药诠释现代公益新范式
发布时间:2025/06/11
如果说慈善事业是企业责任感的一个缩影。那么振东制药的慈善“侧写”便是大爱无疆。山西振东健康产业集团自太行山深处诞生,稳扎稳打、守正创新,跻身中国药企中流砥柱行列。引导旗下公益扶贫办凝聚共识、加强合作...
-

创客匠人联合主办第二届中国心理学应用发展大会,深耕“AI+心理学”应用
发布时间:2025/05/30
导语: 2025年5月24日,第二届中国心理学应用发展大会在杭州水博园盛大开幕。作为联合主办方,创客匠人通过“AI+心理学应用”圆桌论坛和“心理人的破局发展”工作坊两大核心活动,为3000余名参会者带来前沿的数字化解决方...
-

纳斯达克‖飞兔商联启航全产业链聚合生态重构行业格局
发布时间:2025/05/27
在互联网行业爆发式增长的浪潮中,贵州飞兔商联云信息技术有限公司(以下简称“飞兔商联”)以“科技+线上+线下”三位一体的合伙人创新模式,成为资本市场瞩目的焦点。作为中国互联网全产业链聚合生态的构建者,公司...
-
 看空报告全文来了")
浑水协助Wolfpack做空爱奇艺(IQ.US) 看空报告全文来了
发布时间:2020/04/08
本文来源“腾讯网”。 划重点:1.两家中国广告公司向我们提供了爱奇艺(IQ.US)后端系统的数据,这些数据显示,从2019年9月开始,爱奇艺的实际移动DAU比该公司在2019年10月宣称的1.75亿平均移动DAU低了60.3%。2.大约3...
-
目标股价达600美元,仍有18%上行空间")
华尔街大佬巴鲁克:特斯拉(TSLA.US)目标股价达600美元,仍有18%上行空间
发布时间:2020/04/08
本文来自“腾讯证券”。 在券商杰富瑞(Jefferies)将特斯拉评级从“持有”上调到“买入”后,特斯拉(TSLA.US)在周一收盘上涨逾7.5%。上周五,特斯拉也因公司第一季度业绩强劲而迎来上涨。数据显示,该公司第一季度共...
-

不满足于流媒体业务,亚马逊也要开始做游戏了
发布时间:2020/04/08
本文来源“36氪”。为了在统治数字娱乐的战役中开辟新战线,Amazon(AMZN.US)正在投入数亿美元以成为视频游戏的领先制作商和发行商。由于卫生事件的影响数度推迟之后,这家互联网巨头表示,打算在5月发布其首款原创...
-

刘强东“熔断”,徐雷成为京东的新“保险丝”
发布时间:2020/04/08
本文来自“盒饭财经”。公共卫生事件笼罩世界,全球经济遭遇重创,金融市场难以幸免,“熔断”一词频繁走入人们视野中。 作为在美股上市的企业,京东(JD.US)最近的日子也不太好过。瑞幸造假事件曝出后,京东“二号人...
Best Crypto Liquidation Map Tools in2026
发布时间:2026/03/18 区块链 浏览次数:356
1. Price alone never tells the full story.
The sharpest moves happen where crowded positions sit, where funding gets stretched, where open interest builds too fast.
That’s why serious traders obsess over liquidation maps. Here’s how the top 3 stack up
2.Why do liquidation maps matter?
When overleveraged positions get forced out, they don’t just close quietly — they add fuel to the move.
Heavy shorts above price? A breakout turns into a squeeze. Stacked longs below weak momentum? A flush hits deeper than anyone expects.
Context changes everything.
3.But a clean chart isn’t enough.
The best liquidation map tool gives you:
Real-time liquidation clusters
Funding rates
Open interest
Long/short positioning
Exchange-level signals
Order book depth
Miss one layer and you’re flying half-blind.
4. Here’s the thing most traders ignore:
A liquidation zone by itself is just noise.
BTC approaching a dense cluster hits different when:
→ Funding is already elevated
→ OI expanded into the move
→ Order book liquidity is thinning near that level
That’s where the edge actually lives.
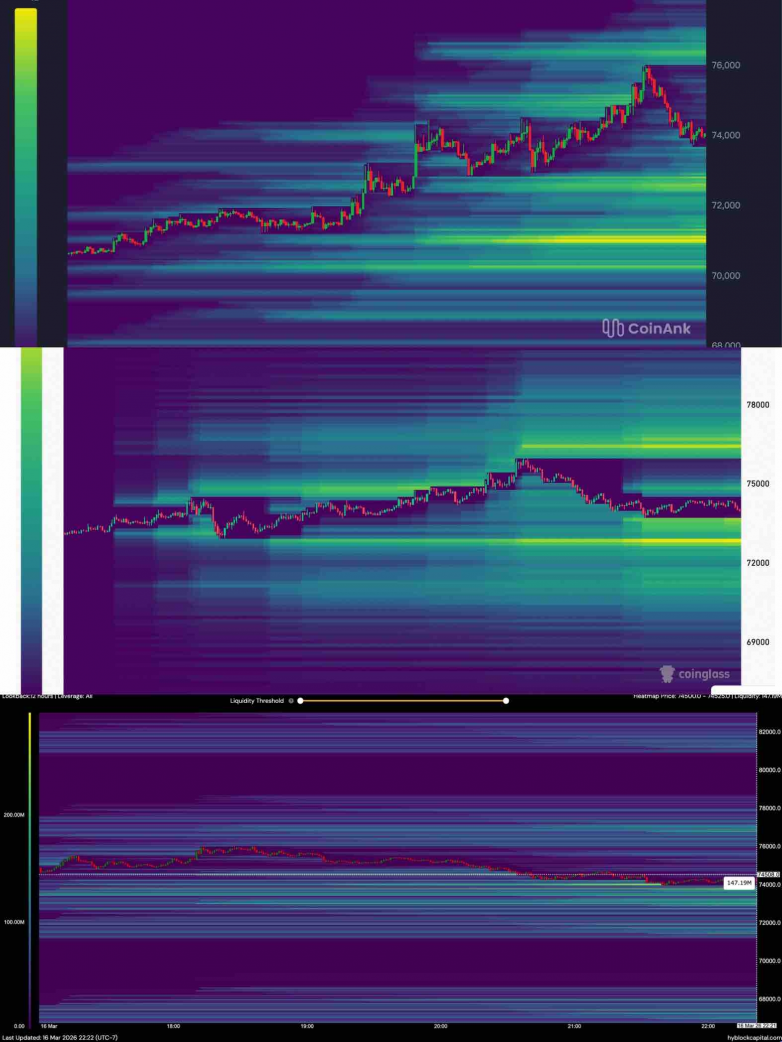
5. So which platform wins in 2026?
CoinAnk vs CoinGlass vs Hyblock — we broke down all three:
→ Real-time data coverage
→ Heatmap quality & UX
→ Derivatives dashboard depth
→ Fit for different trading styles
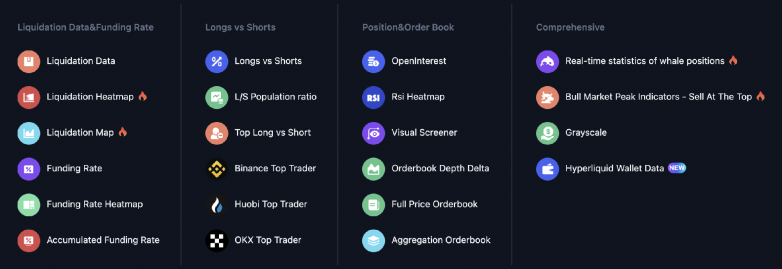
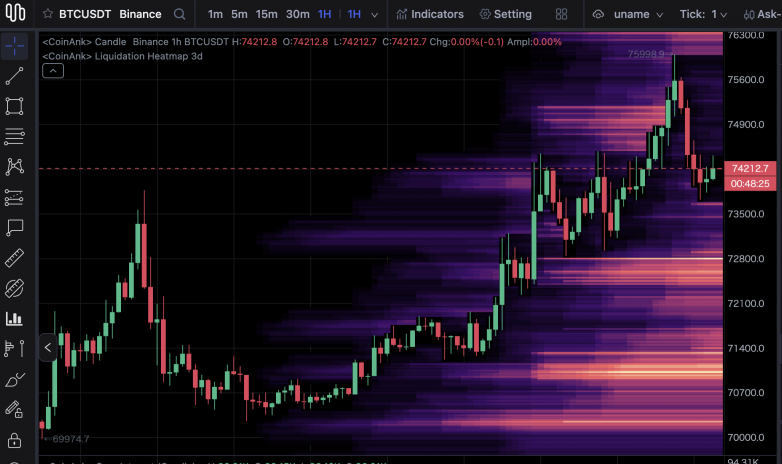
CoinAnk is a data platform focused on crypto derivatives monitoring, covering five core areas:
Liquidation Data · Funding Rates · Long/Short Positioning · Open Interest · Order Book Signals
Beyond that, it also provides real-time market metrics, heatmaps, visual screeners, and API access.
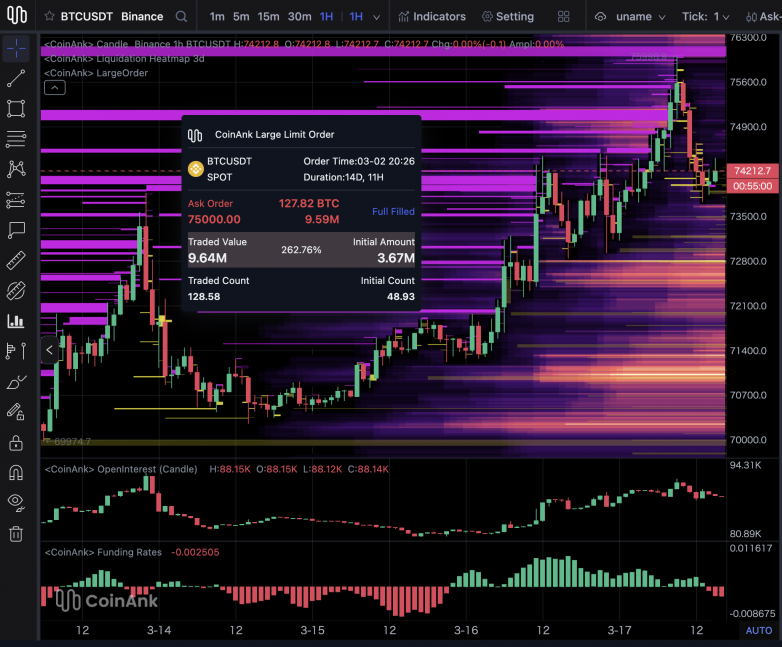
CoinAnk’s true value lies in workflow integration. There’s no need to jump between multiple tools — from liquidation heatmaps to funding rates to positioning structure, one platform handles it all.
Typical workflow: Scan heatmaps → Check funding rates → Review long/short ratio → Confirm open interest → Validate order book signals → Execute
CoinGlass is a well-known name in the derivatives space, appearing frequently in liquidation map searches with a solid established user base.
Choosing between CoinAnk and CoinGlass isn’t about brand recognition — it’s about which one fits your workflow.
If you need heatmaps, screeners, and derivatives signals in one place, and API access matters to your setup, CoinAnk deserves a serious look.
Hyblock is known for its liquidation heatmaps and market structure visuals, with a loyal following.
Traders searching for a Hyblock alternative usually have one of two needs: a different data workflow, or broader derivatives coverage in a single place.
If you currently need multiple tabs open just to complete one market analysis, CoinAnk’s consolidated dashboard can meaningfully improve your efficiency — especially during high-volatility sessions.
Which Traders Is CoinAnk Built For?
Discretionary Traders If you rely on chart structure and market sentiment, you need a clean interface with the right information density. CoinAnk pairs liquidation views with surrounding derivatives context, helping you avoid treating liquidation levels as standalone signals.
Derivatives-Focused Traders If your decisions depend on positioning structure rather than price action alone, a map isn’t enough. Is OI rising into the move? Is funding overheated? Is positioning one-sided? CoinAnk covers all of it.
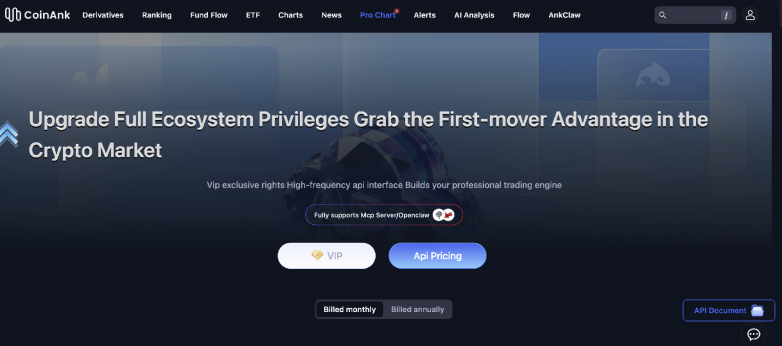
API / Quant Users CoinAnk offers API access to support custom dashboards, alert systems, and quantitative workflows — for users who need more than browser-based data viewing.
Questions to Ask Before Choosing a Platform
Can you read the market fast during volatility? A good tool accelerates decisions, not slows them down.
Does the platform offer more than liquidation data? Liquidation zones paired with funding rates and OI carry far more signal weight.
Does the interface match your trading habits? Manual traders care about layout. Data users care about API.
Can it support multi-asset scanning? It’s not just BTC and ETH — screeners determine how fast you can scan the market.
Does it reduce tool switching? Attention is your most valuable resource in trading. Don’t waste it on tab hopping.
What is the best crypto liquidation map in 2026? It depends on how you trade. If you need liquidation views combined with funding rates, OI, long/short positioning, and order book signals in one place, CoinAnk is the option worth prioritizing.
Can CoinAnk replace CoinGlass? Yes. For traders who want a complete derivatives workflow under one roof, CoinAnk offers broader feature coverage and deeper workflow integration.
What makes a good Hyblock alternative? Clear liquidation visuals backed by enough supporting data to validate setups. CoinAnk’s depth of integration makes it a strong candidate worth trying.
How should you use a crypto liquidation heatmap? Use it as context, not as a standalone entry signal. Combine it with funding rate extremes, OI shifts, and order book behavior — that’s when signal reliability goes up significantly.
Can a liquidation map predict exact price movements? No. It shows areas where forced liquidations may occur, but actual price behavior still requires risk management and additional data to navigate properly.
When searching for the best crypto liquidation tool, focus on workflow — not brand noise.
What you need is a platform that helps you read liquidations in context and act fast when markets move.
Visit coinank.com — compare the dashboards and derivatives data against your current process, and see if it fits.